Network Topology Visualization
Visualize your network infrastructure on interactive 2D and 3D canvases with force-directed and hierarchical layouts, real-time device status, annotations, and topology export capabilities.
Overview
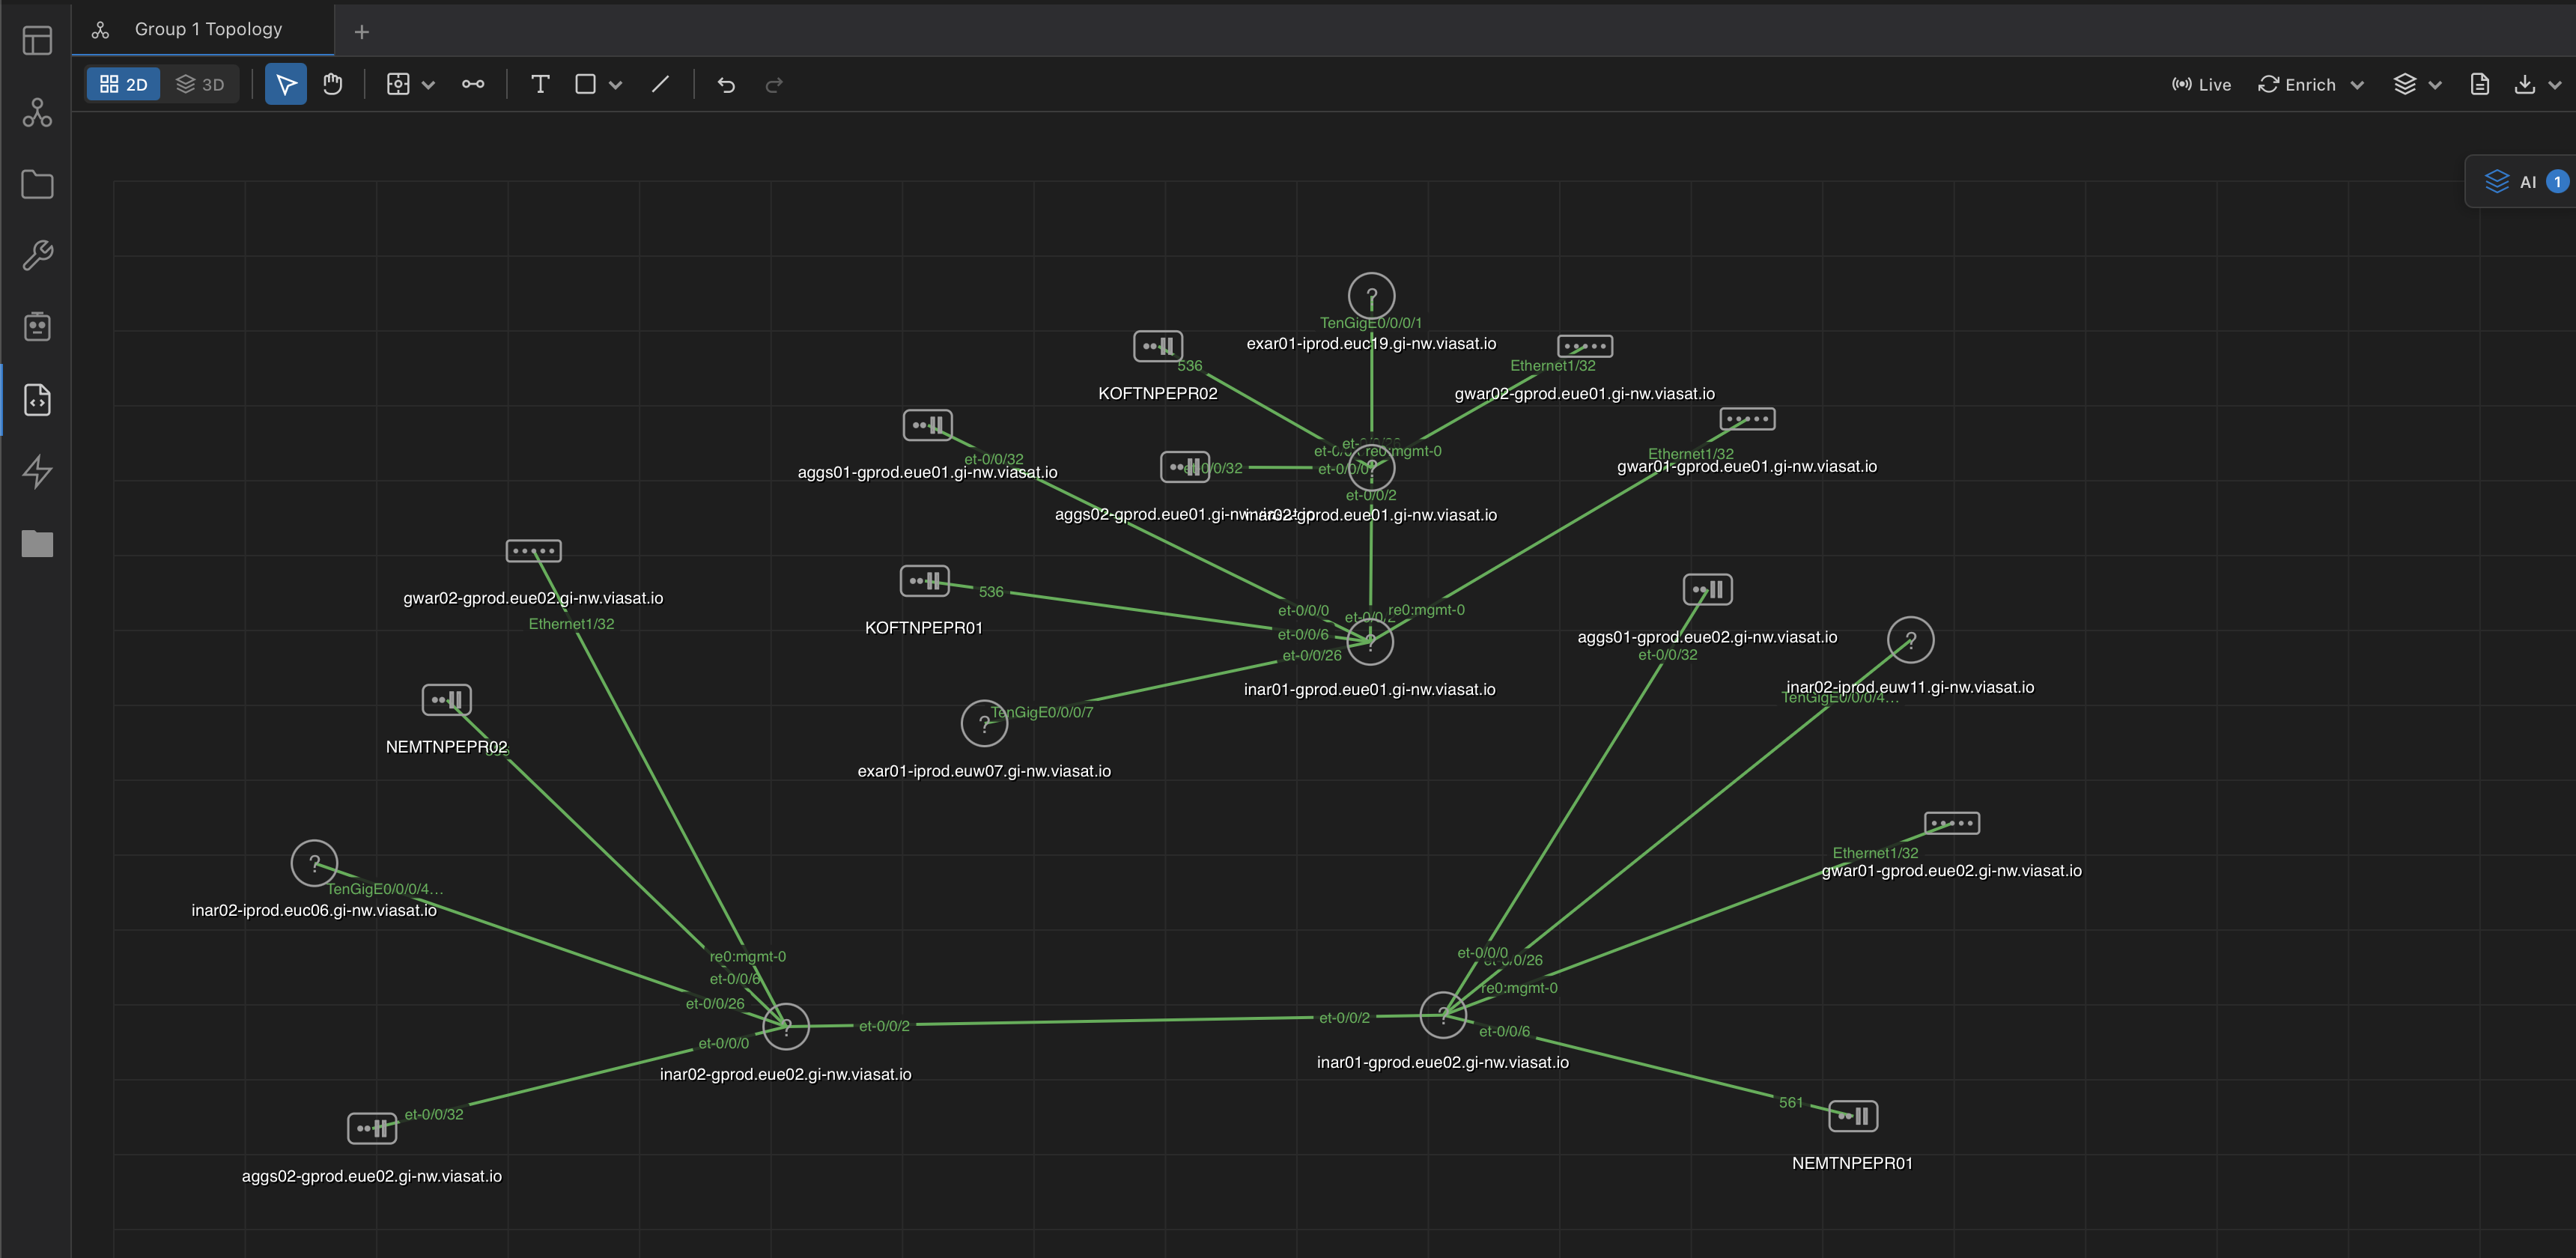
Network Topology Visualization provides an interactive map of your network infrastructure, showing devices as nodes and their interconnections as links. Built from discovery data and manual connections, the topology view gives you an at-a-glance understanding of your network architecture with real-time status overlays.
Visualization Modes
- 2D Canvas (SVG) -- lightweight, fast-rendering topology view ideal for most networks. Supports pan, zoom, drag, and click-to-connect interactions.
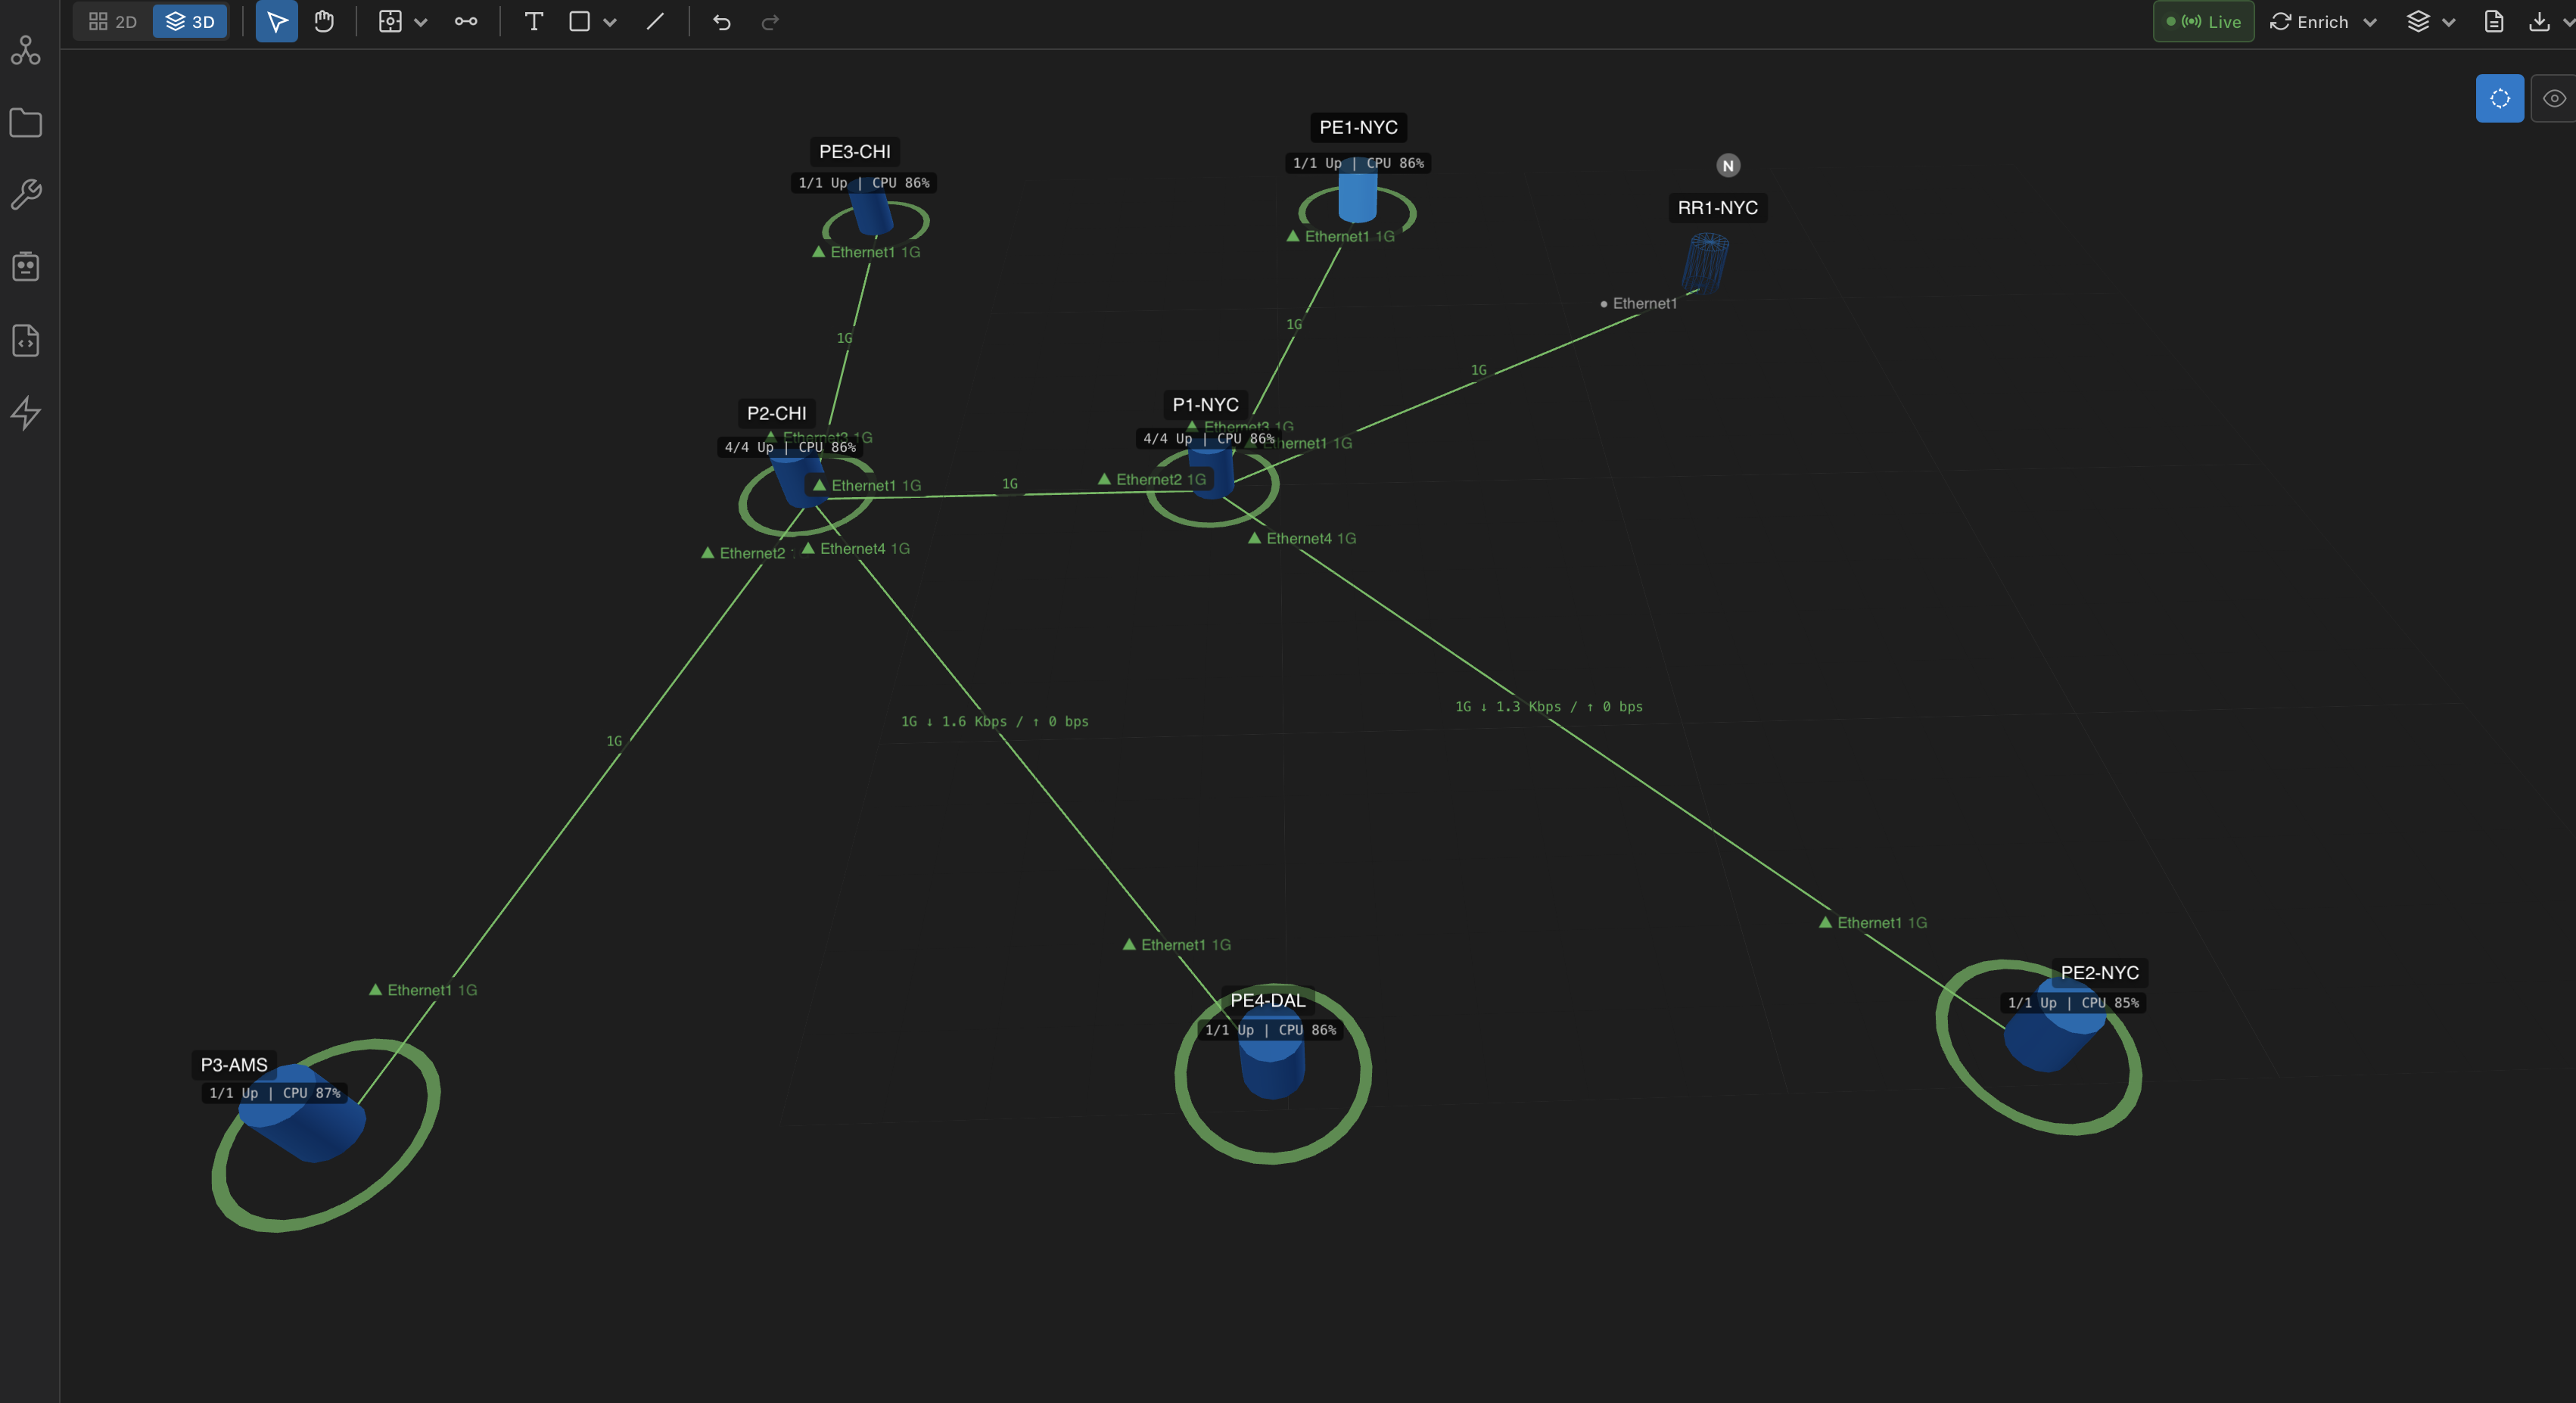
- 3D Canvas (WebGL) -- immersive three-dimensional view for large-scale networks, allowing you to rotate, orbit, and navigate through the topology in 3D space.
Key Capabilities
- Multiple layout algorithms -- force-directed, hierarchical, radial, and grid layouts to organize devices automatically
- Real-time status -- device nodes reflect live status (up, down, degraded) with color-coded indicators
- Annotations -- add labels, notes, and boundary groups to document your topology
- Export -- export topology maps as PNG, SVG, or PDF for documentation and reporting
The topology view is populated automatically from Network Discovery results. Run a discovery scan first to build the link data that powers the topology visualization.
How It Works
Topology Data Model
The topology is built from two data sources: device records (nodes) and link relationships (edges). Links are discovered automatically from LLDP/CDP neighbor data during network discovery, or created manually by connecting devices in the topology view.
Layout Algorithms
| Algorithm | Best For | Description |
|---|---|---|
| Force-directed | General purpose | Simulates physical forces to space devices organically. Connected devices cluster together. |
| Hierarchical | Campus/DC networks | Arranges devices in tiers: core at top, distribution in middle, access at bottom. |
| Radial | Hub-and-spoke | Places a central device at the center with connected devices radiating outward in concentric rings. |
| Grid | Large flat networks | Arranges devices in a uniform grid, useful for comparing many similar devices. |
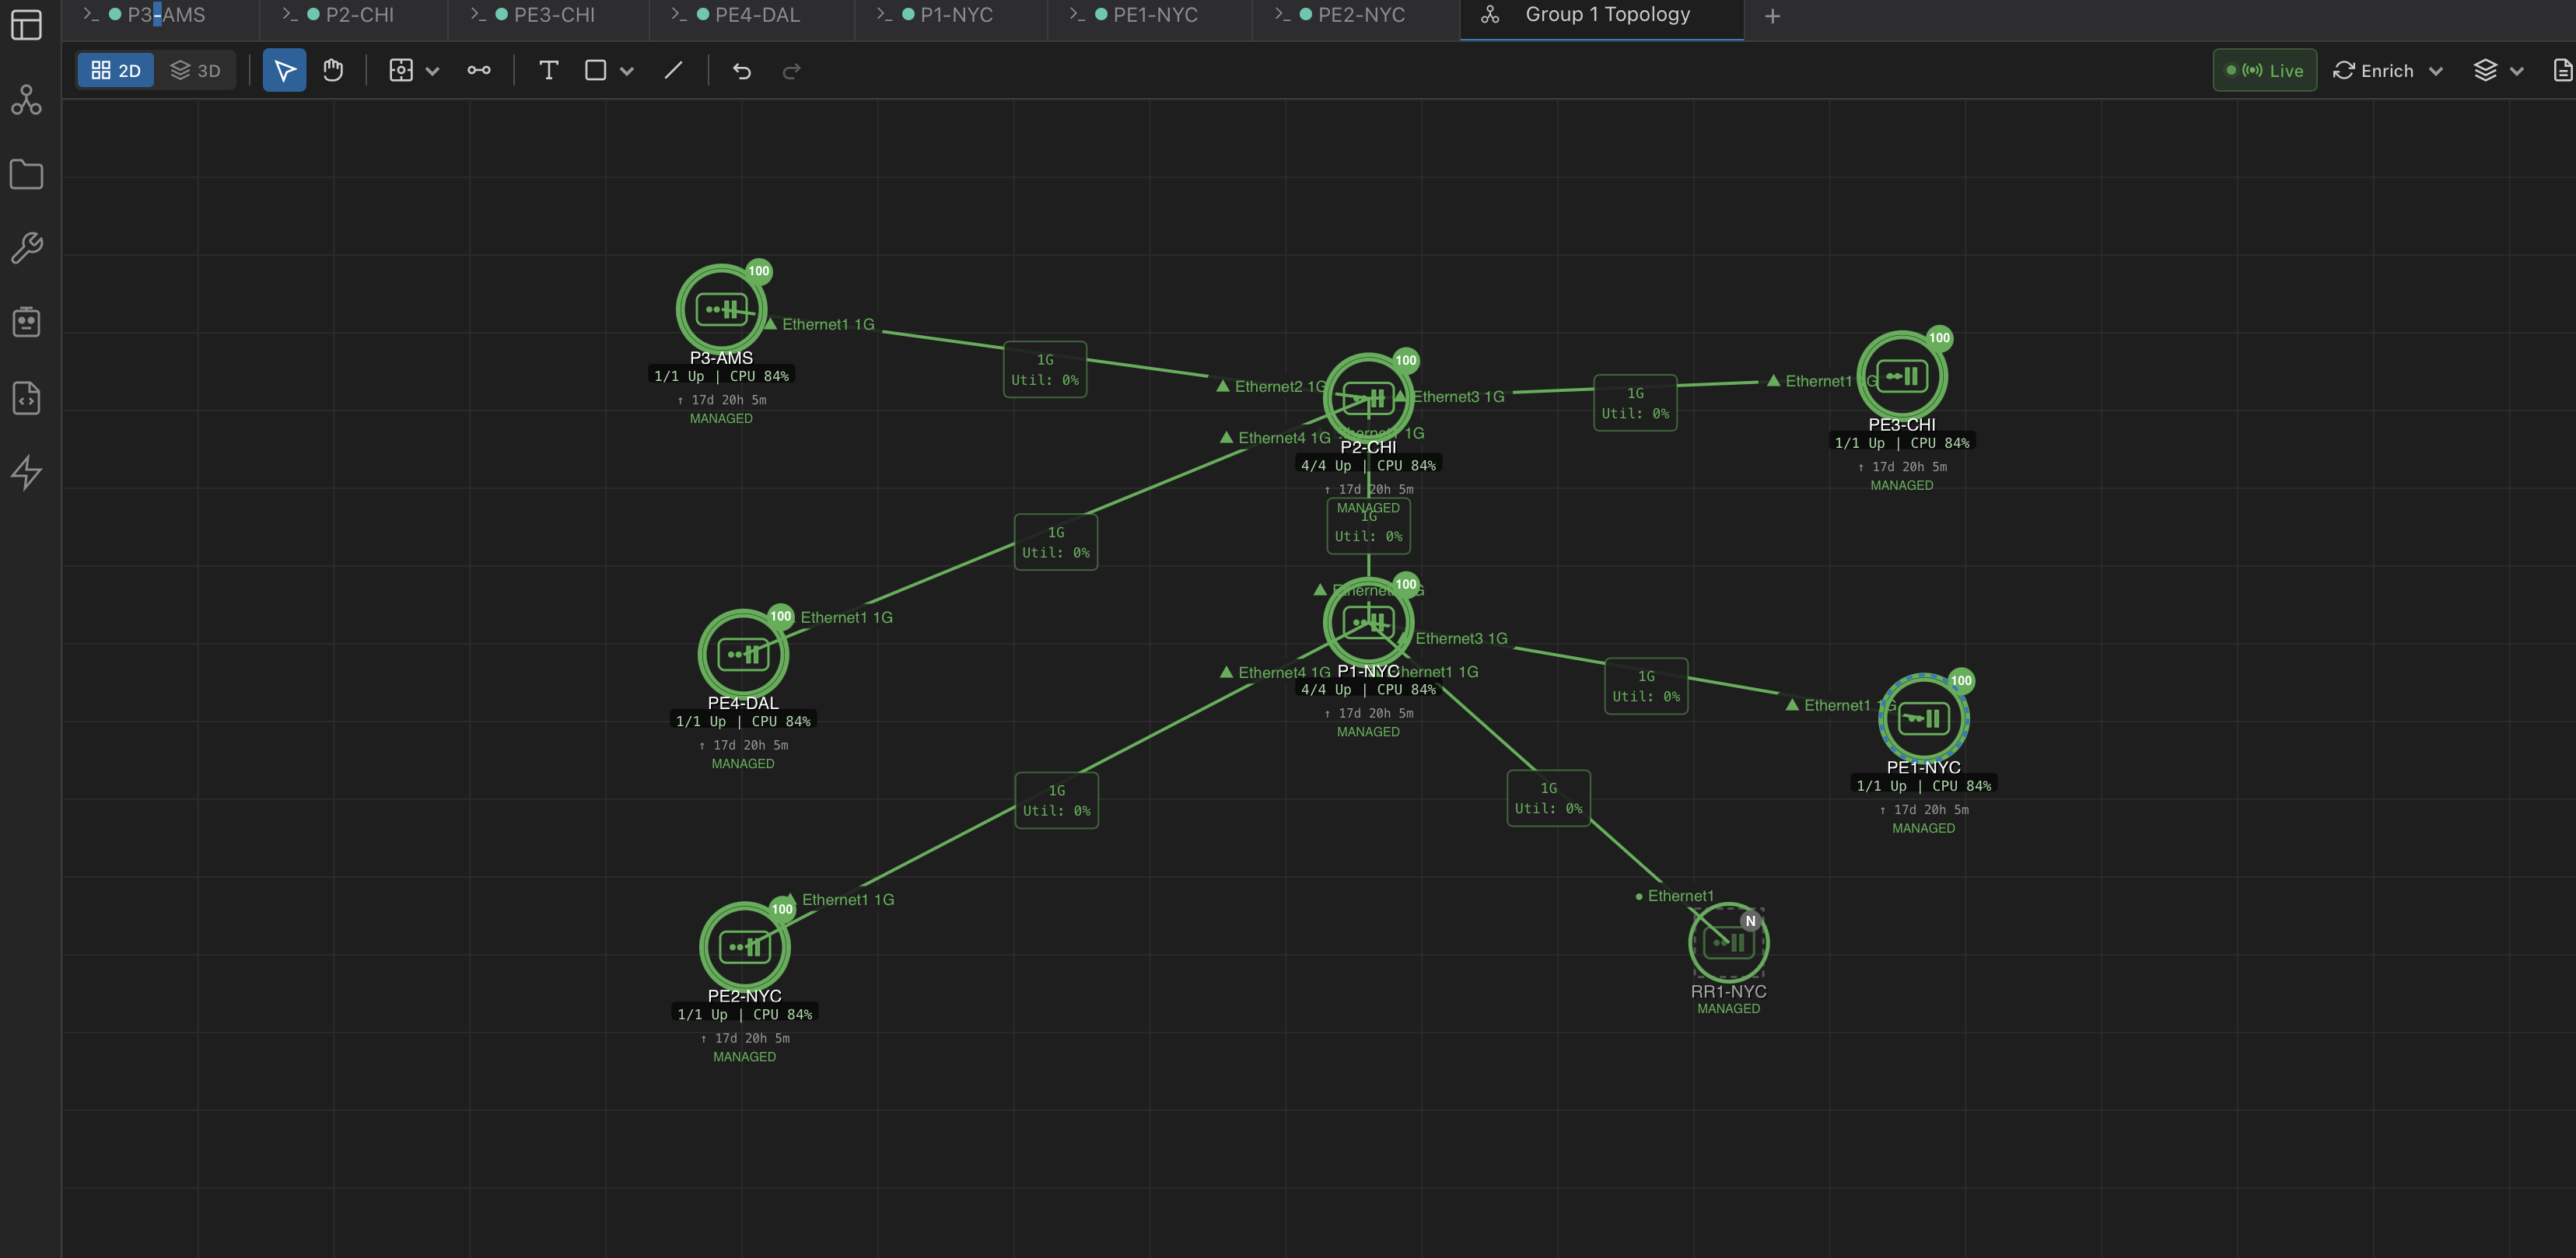
Real-Time Status Overlay
Device nodes are color-coded based on their current status. Status is polled at a configurable interval (default 30 seconds) and updated on the canvas without requiring a page refresh:
- Green -- device is reachable and responding normally
- Red -- device is unreachable or down
- Yellow -- device is degraded (high CPU, memory, or interface errors)
- Gray -- device status is unknown or not being monitored
Canvas Rendering
The 2D view uses SVG rendering for crisp visuals at any zoom level. The 3D view uses WebGL for hardware-accelerated rendering. Both views support interactive controls including pan, zoom, node dragging, and click-to-select.
Step-by-Step Guide
Workflow 1: Open and Navigate the Topology View
- Navigate to Device Management → Topology
- The topology loads with the default force-directed layout
- Use scroll to zoom in/out, click and drag to pan, and click a device node to view its details
- Double-click a device to open a terminal session directly from the topology view
Workflow 2: Change the Layout Algorithm
- Click the Layout dropdown in the topology toolbar
- Select a layout algorithm (Force-directed, Hierarchical, Radial, or Grid)
- The topology re-arranges automatically. Adjust spacing and grouping parameters in the layout settings panel.
Workflow 3: Add Annotations and Boundary Groups
- Click Annotate in the toolbar to enter annotation mode
- Draw boundary boxes around groups of devices to create visual groupings (e.g., "DC1 Core", "Branch Office")
- Click anywhere on the canvas to add a text label
- Save the layout -- positions and annotations are persisted for all users
Workflow 4: Export the Topology
- Click Export in the toolbar
- Select the format: PNG (raster), SVG (vector), or PDF (print)
- Optionally include the legend and status indicators in the export
- Download the file for documentation or reporting
Device positions are saved when you click Save Layout. All team members see the same topology arrangement, ensuring consistent understanding of the network architecture.
Code Examples
Query Topology Data via API
# Get topology nodes and links
GET /api/v1/topology

# Response
{
  "nodes": [
    {
      "id": "dev_001",
      "hostname": "core-rtr-01.dc1",
      "platform": "Cisco IOS-XE",
      "status": "up",
      "position": { "x": 400, "y": 100 },
      "group": "DC1 Core"
    },
    {
      "id": "dev_002",
      "hostname": "dist-sw-01.dc1",
      "platform": "Cisco NX-OS",
      "status": "up",
      "position": { "x": 300, "y": 250 },
      "group": "DC1 Distribution"
    }
  ],
  "links": [
    {
      "source": "dev_001",
      "target": "dev_002",
      "source_port": "GigabitEthernet0/0/0",
      "target_port": "Ethernet1/1",
      "link_type": "ethernet",
      "speed": "10Gbps",
      "status": "up"
    }
  ]
}
Custom Layout Configuration
{
  "layout": "hierarchical",
  "options": {
    "direction": "top-to-bottom",
    "tier_mapping": {
      "core": { "tier": 1, "match": ["*core*", "*rtr*"] },
      "distribution": { "tier": 2, "match": ["*dist*", "*agg*"] },
      "access": { "tier": 3, "match": ["*access*", "*sw*"] }
    },
    "spacing": {
      "horizontal": 200,
      "vertical": 150
    },
    "group_by": "location"
  }
}
Annotation Configuration
# Add a boundary group annotation
POST /api/v1/topology/annotations
{
"type": "boundary",
"label": "DC1 Core Layer",
"color": "#2563eb",
"opacity": 0.1,
"bounds": {
"x": 200, "y": 50,
"width": 400, "height": 200
},
"devices": ["dev_001", "dev_003"]
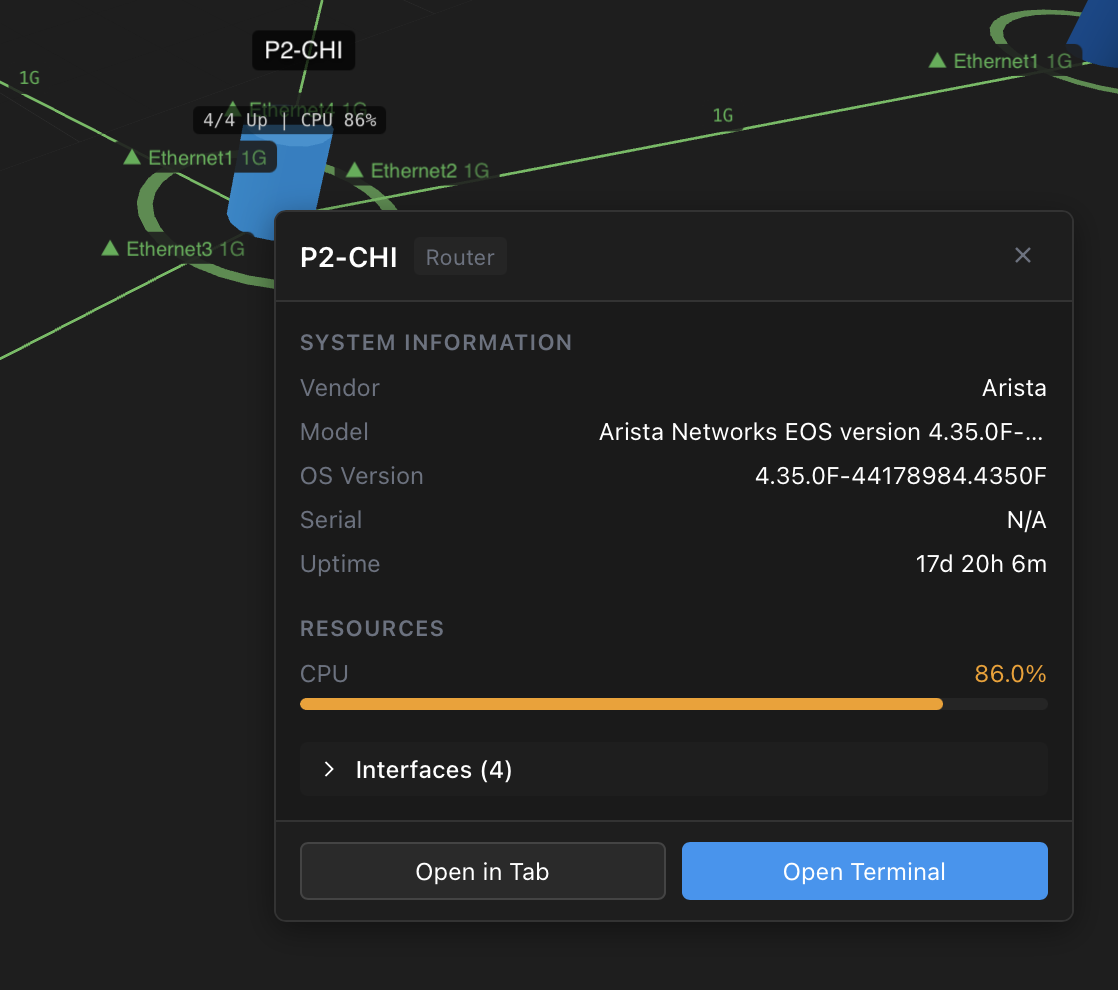
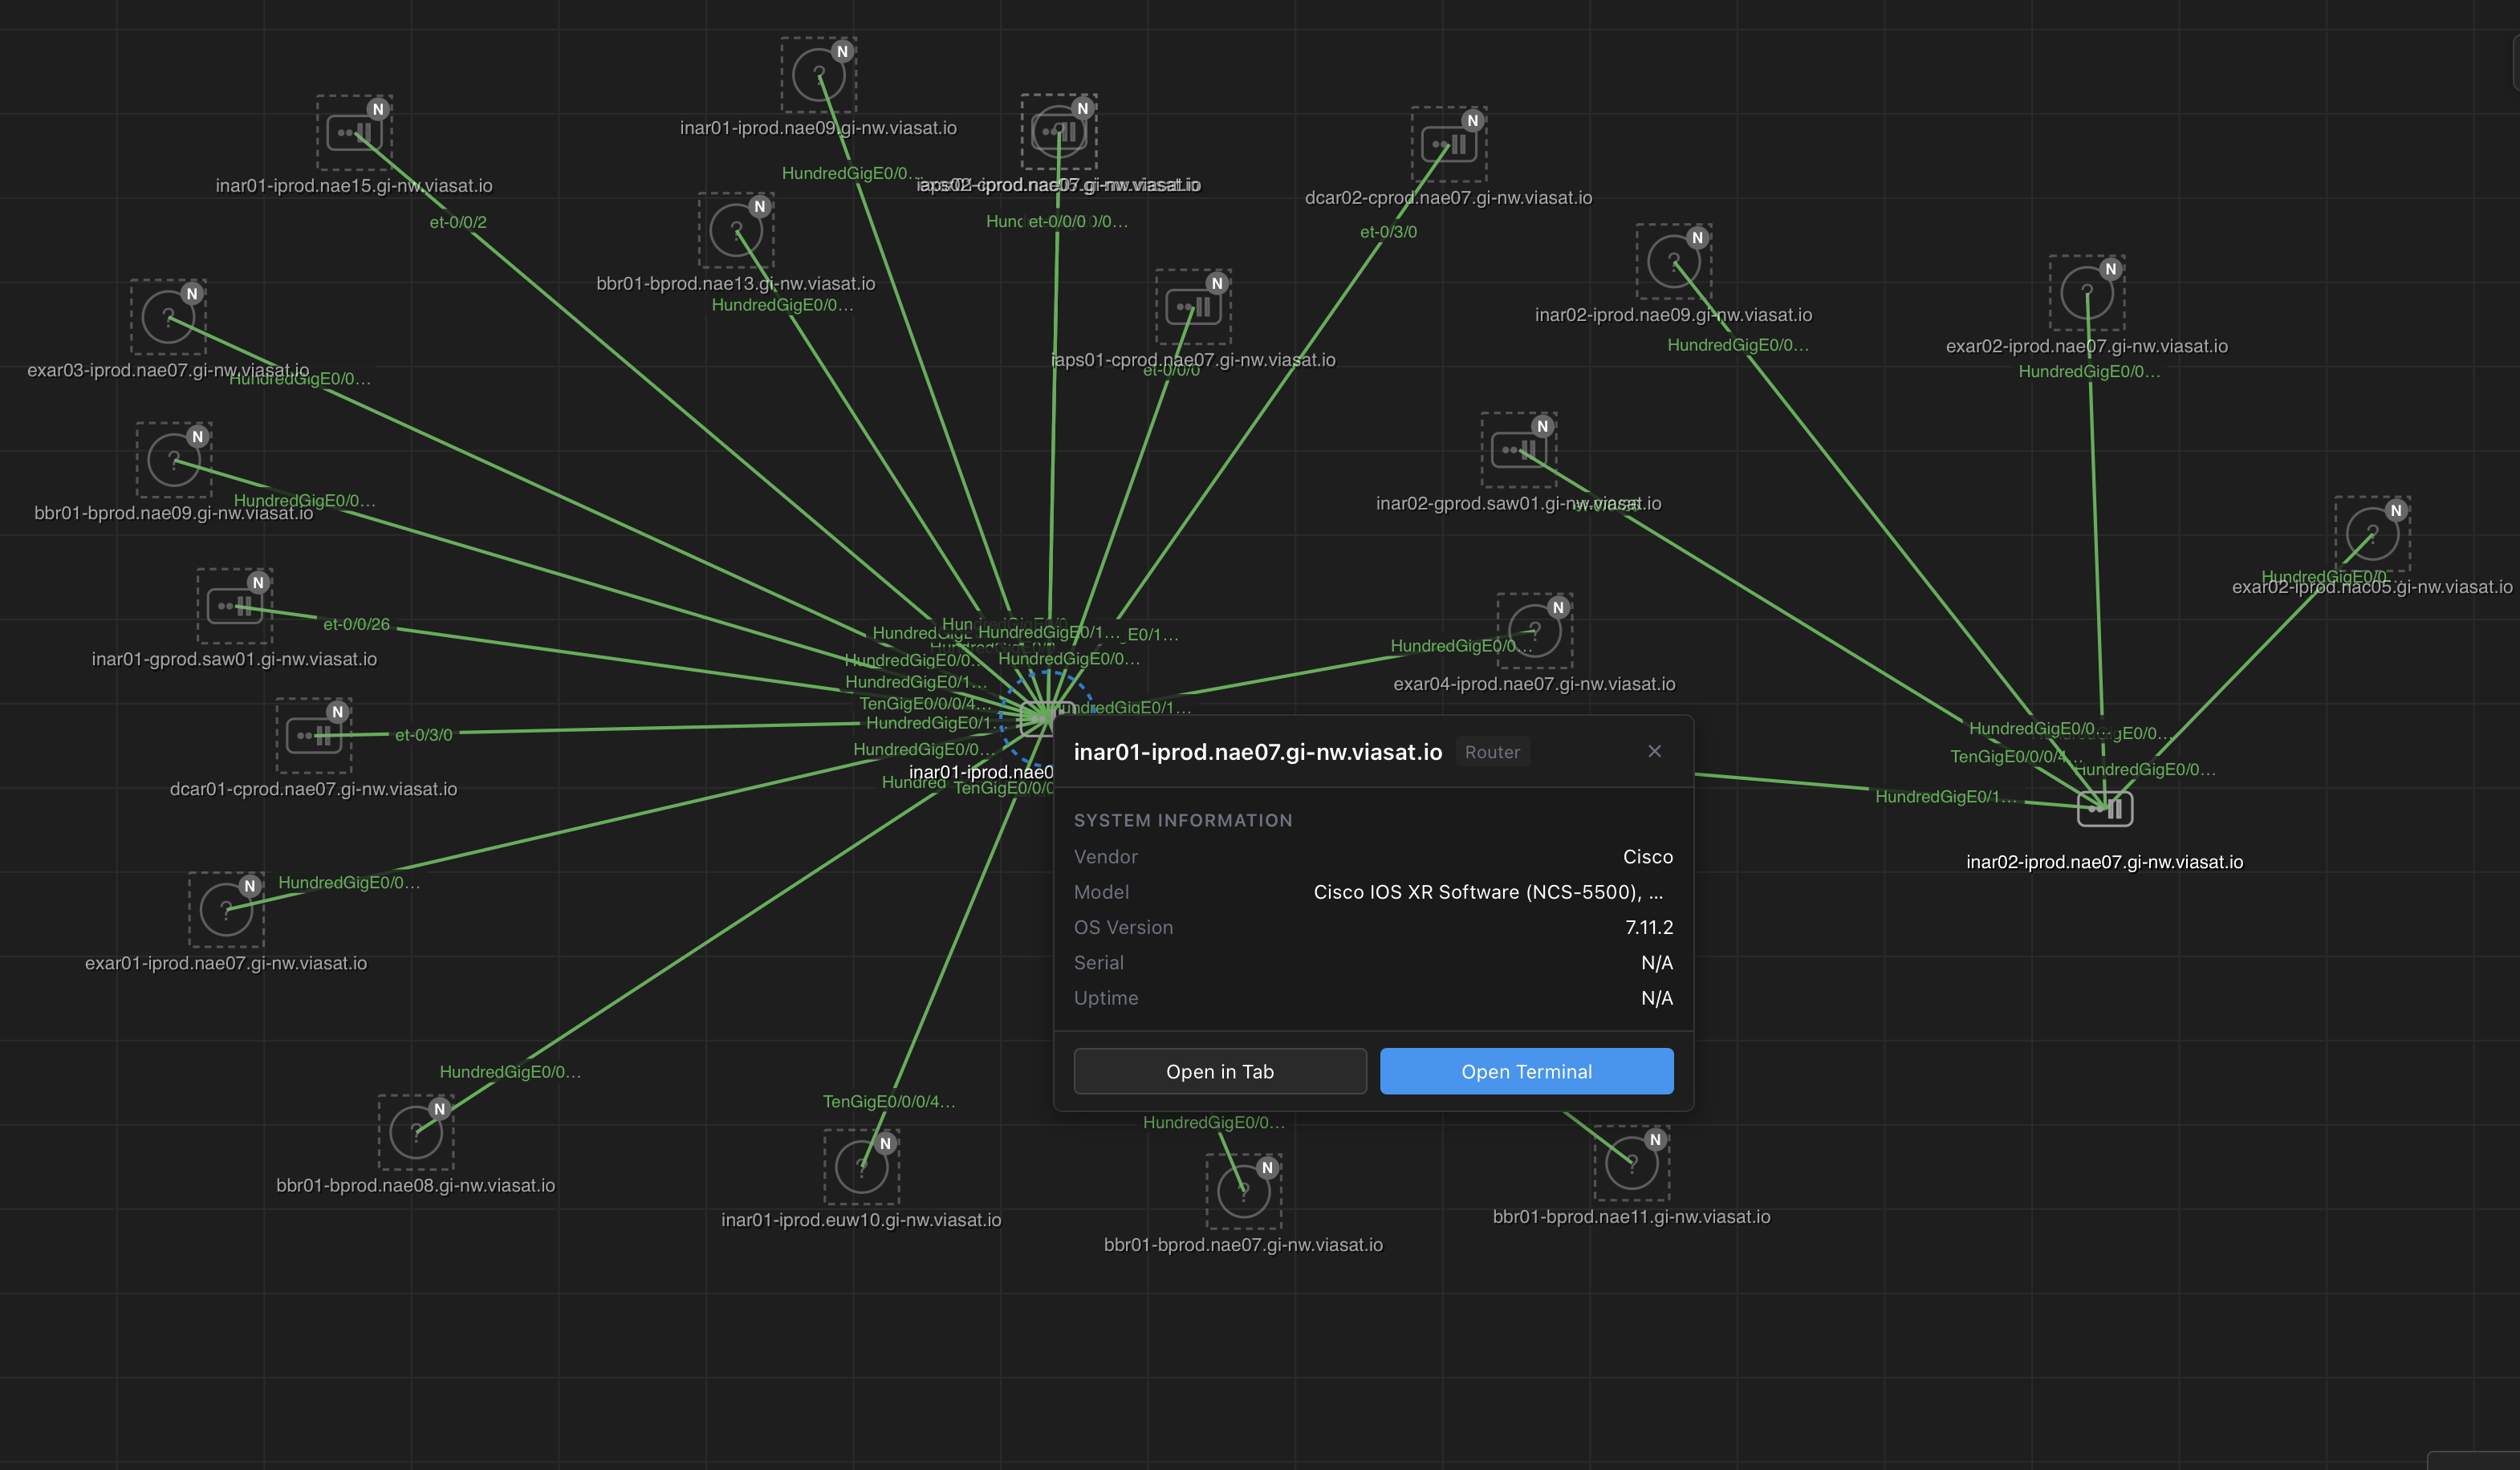
}Real-World Topology Example
A production network topology with device details popup showing system information and the option to open a terminal session:
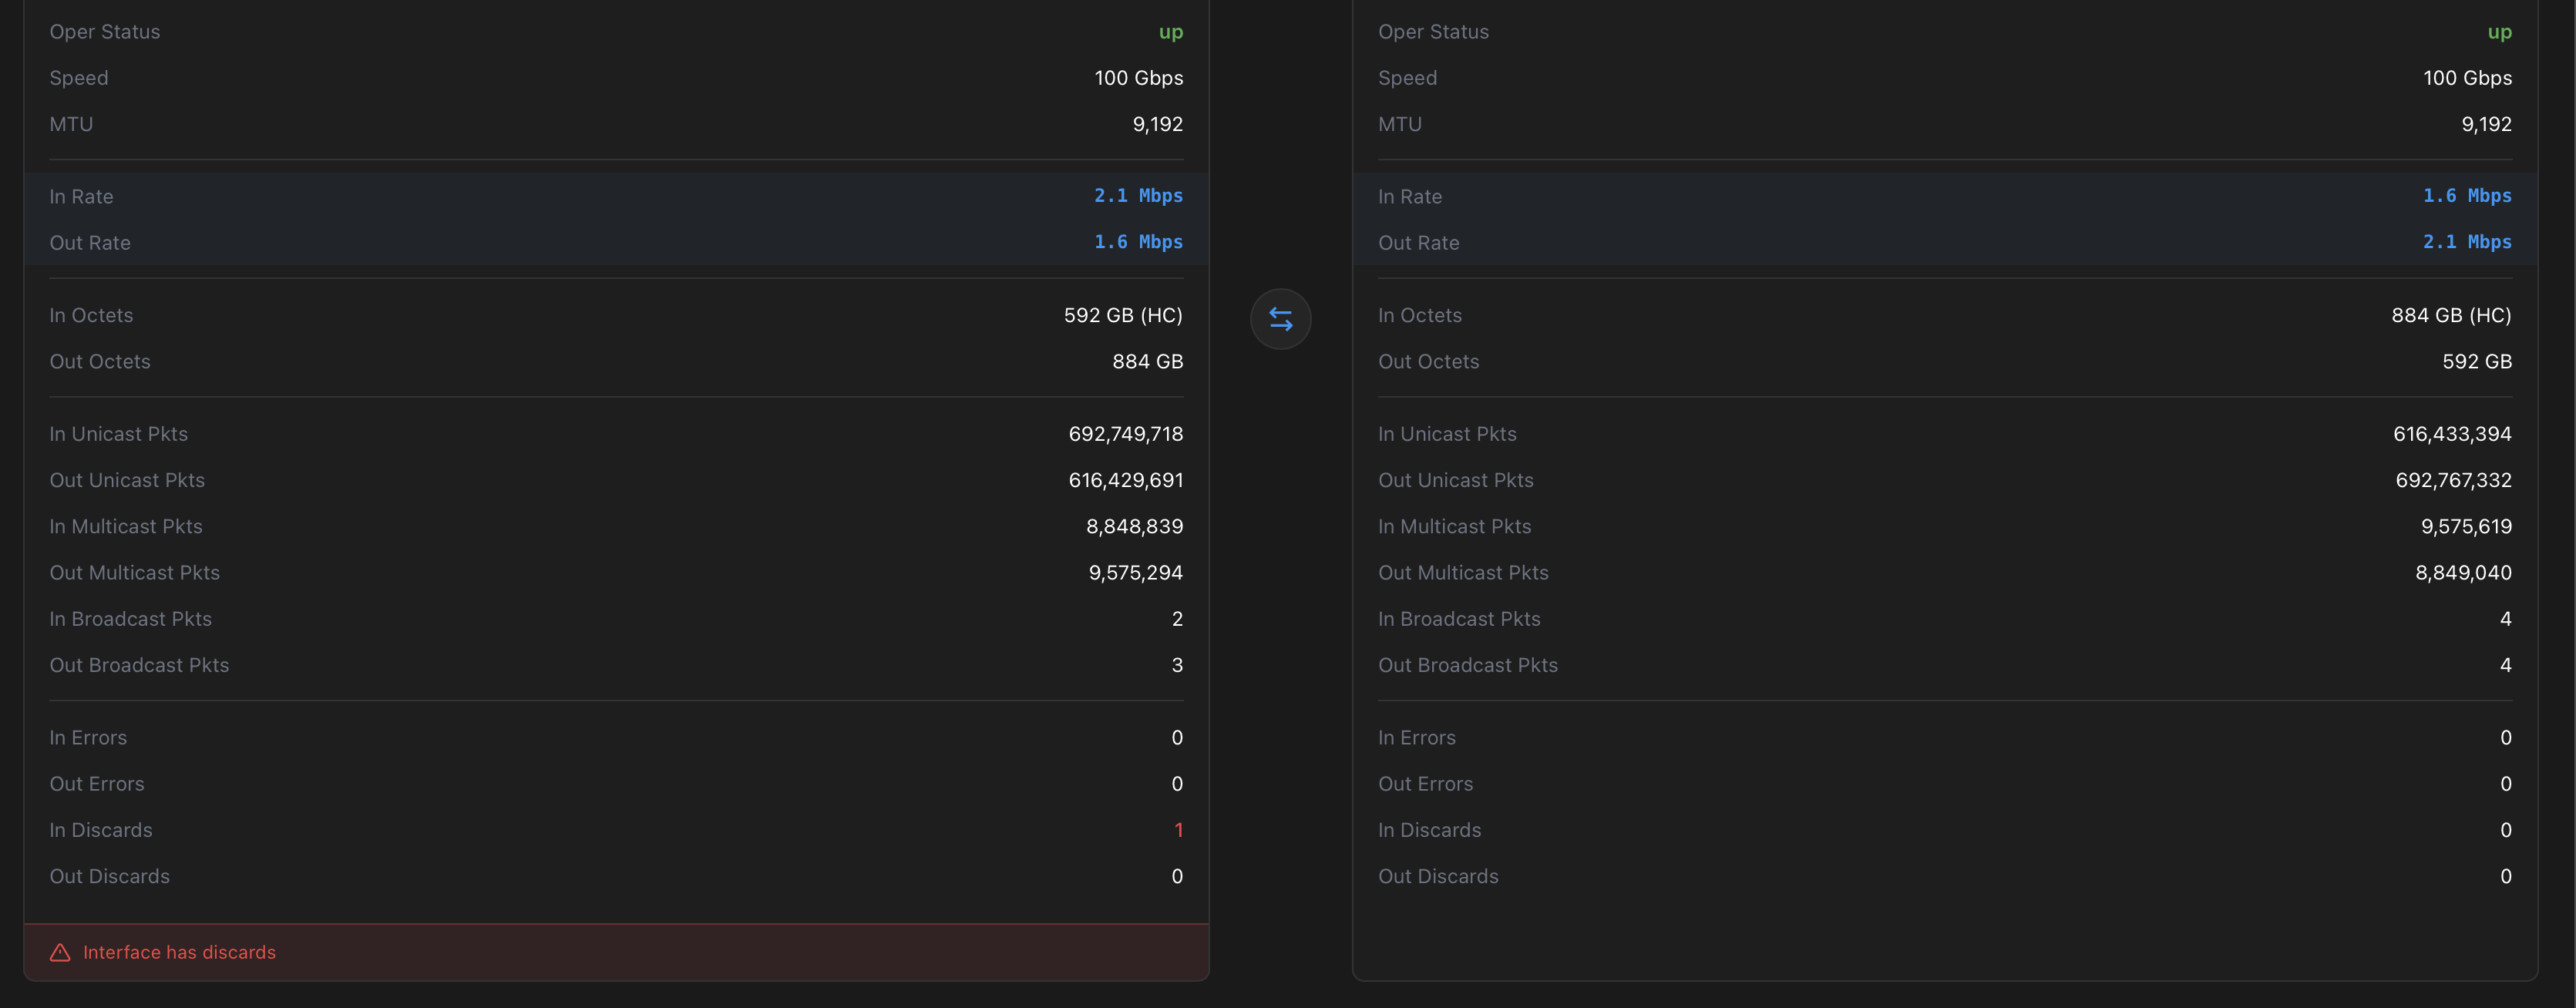
SNMP Interface Statistics
Click a link between two devices to view SNMP interface counters for both ends of the connection, including traffic rates, errors, and discards:
Export Options
# Export topology as PNG
GET /api/v1/topology/export?format=png&width=1920&height=1080&include_legend=true

# Export topology as SVG (vector, scalable)
GET /api/v1/topology/export?format=svg&include_status=true

# Export topology as PDF (print-ready)
GET /api/v1/topology/export?format=pdf&orientation=landscape&paper=a3
Q&A
- Q: What layout algorithms are available?
- A: NetStacks provides four layout algorithms: force-directed (organic clustering), hierarchical (tiered core/distribution/access), radial (hub-and-spoke rings), and grid (uniform arrangement). Each can be customized with spacing, grouping, and direction parameters.
- Q: Can I manually reposition devices on the topology?
- A: Yes. Click and drag any device node to reposition it. Click Save Layout to persist the positions. Manual positions are preserved even when switching layout algorithms -- use Reset Layout to return to automatic positioning.
- Q: Does the topology show real-time device status?
- A: Yes. Device nodes are color-coded by status (green = up, red = down, yellow = degraded, gray = unknown). Status is polled every 30 seconds by default. Link status is also shown with color-coded edges.
- Q: How do I add annotations or labels?
- A: Click the Annotate button in the toolbar to enter annotation mode. Draw boundary rectangles around device groups, or click to place text labels. Annotations are saved with the topology layout and visible to all team members.
- Q: Can I export the topology as an image?
- A: Yes. Click Export in the toolbar and select PNG (raster image), SVG (scalable vector), or PDF (print-ready). You can include the legend and status indicators in the export. Exports capture the current view including annotations and device positions.
- Q: What is the difference between 2D and 3D topology views?
- A: The 2D view uses SVG rendering and is ideal for most networks -- it is fast, lightweight, and produces crisp visuals at any zoom level. The 3D view uses WebGL for hardware-accelerated rendering and is designed for large-scale networks where a three-dimensional perspective helps visualize complex interconnections. The 3D view supports orbit, rotate, and fly-through navigation.
Troubleshooting
Topology Not Rendering
- Verify you have devices in your inventory -- the topology requires at least two devices with link data
- Run a Network Discovery scan to populate link data from LLDP/CDP neighbor tables
- Check browser console for JavaScript errors -- the 3D view requires WebGL support
Missing Links Between Devices
- Links are discovered from LLDP/CDP data. Ensure both devices have LLDP or CDP enabled on their connecting interfaces
- Run a fresh discovery scan to update link data
- Manually create links in the topology view by selecting two devices and clicking Add Link
Performance with Large Topologies
- For networks with 500+ devices, use the 2D view instead of 3D for better performance
- Apply device filters to show only specific groups or locations
- Reduce the status polling interval in Settings to decrease network overhead
- Enable GPU acceleration in your browser for improved rendering
3D View Not Working
- The 3D view requires a browser with WebGL support (Chrome, Firefox, Edge, Safari 15+)
- Check that hardware acceleration is enabled in browser settings
- Some virtual machines and remote desktop sessions do not support WebGL -- use the 2D view in these environments
Related Features
- Adding Devices -- add the devices that appear as nodes in the topology
- Device Types -- device type determines the icon displayed on topology nodes
- Network Discovery -- discovery populates the link data that powers the topology
- Plugin System -- extend topology with custom node types and overlays via plugins