Dashboard & Navigation
EnterpriseFind your way around the NetStacks Controller admin console: the dashboard cards and panels, layout editing, the header, global search and the connection-status popover.
Overview
The admin console is the Controller's web UI at https://<controller>:3000. After signing in you land on the Dashboard (/), a health and activity overview of the organization you are working in and of the platform as a whole.
Console Layout
- Sidebar (left) — the main sections: Dashboard, Inventory, Discovery, Config Automation, AI & Agents, Access & Secrets, Integrations and Activity. A Plugins section appears when plugins with pages are enabled (for example Alerts and Incidents). At the bottom are Settings, Administration, Collapse, and your name with a sign-out icon.
- Administration opens the Admin area with its own sub-menu: People (Users, Roles, Organizations), System (License, Plugins, Platform Health, Jumpboxes, Audit Logs, Deployment Info) and AI (LLM Providers, AI Profiles, Task Limits), plus a Search… box to filter it.
- Which sections you see depends on your permissions: Settings requires System Settings, and Administration requires Users & Roles.
Dashboard Stat Cards
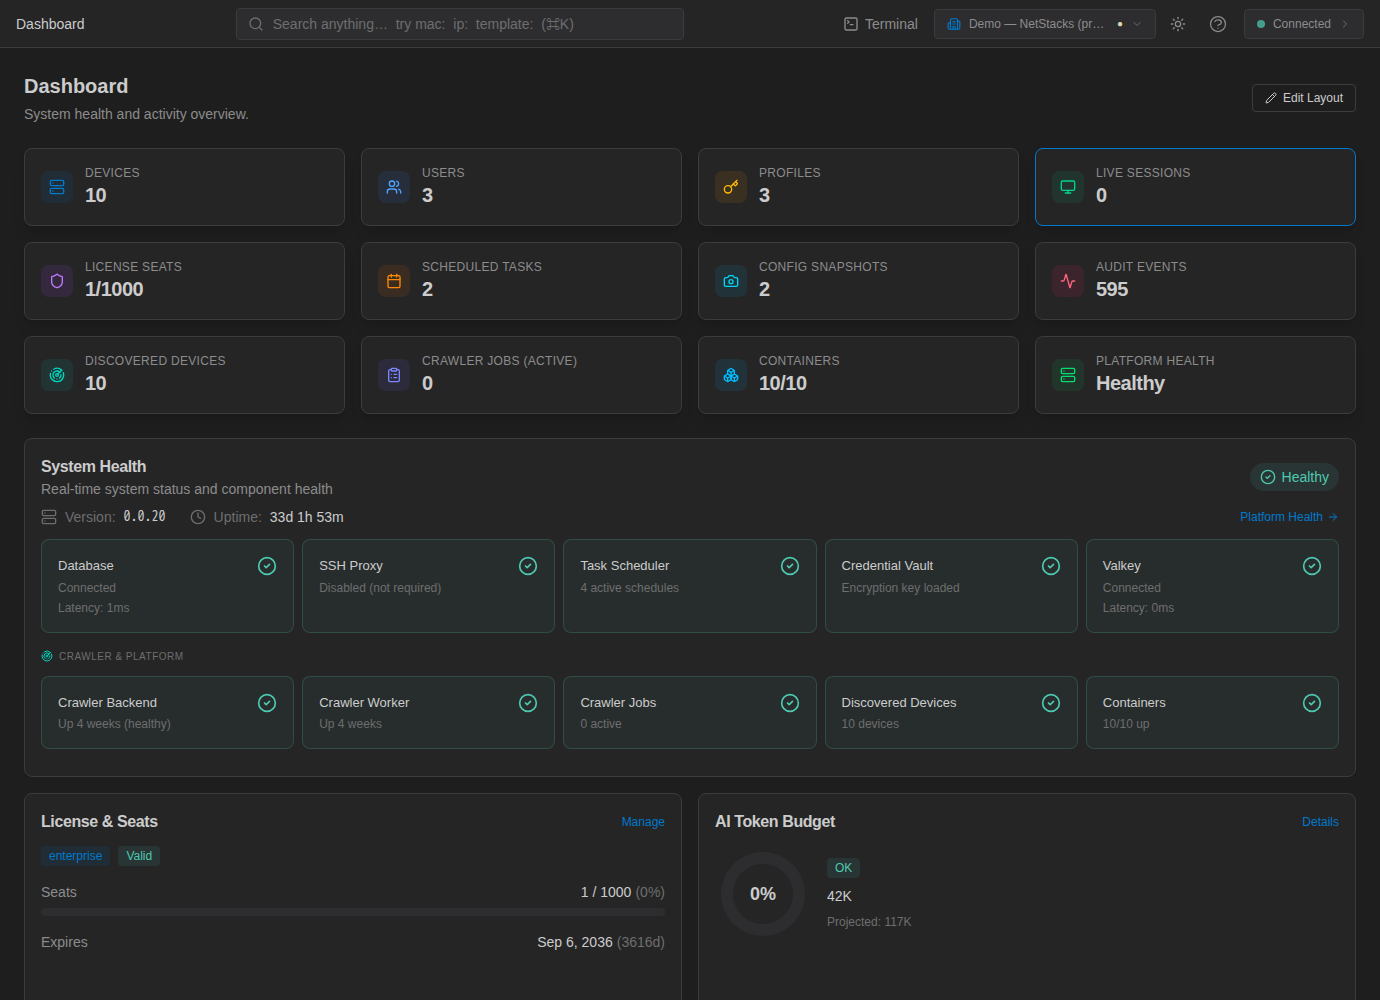
The top of the dashboard shows twelve counters:
| Card | Shows |
|---|---|
| Devices | Managed devices in the inventory |
| Users | User accounts |
| Profiles | Connection profiles |
| Live Sessions | Active SSH sessions brokered by the Controller |
| License Seats | Seats in use / licensed seats |
| Scheduled Tasks | Scheduled tasks defined |
| Config Snapshots | Config backup snapshots |
| Audit Events | Total audit log entries |
| Discovered Devices | Devices found by discovery |
| Crawler Jobs (active) | Discovery jobs currently running |
| Containers | Platform containers running / total |
| Platform Health | Overall health (for example Healthy) |
Dashboard Panels
Below the cards, panels give more detail. Most have a link (such as Manage, Details or View all) to the full page.
| Panel | Contents |
|---|---|
| System Health | Version, uptime, and status of Database, SSH Proxy, Task Scheduler, Credential Vault and Valkey, plus crawler and container status; links to Platform Health |
| License & Seats | Tier, status, seats used and expiry |
| AI Token Budget | Token usage against the monthly budget, with projection |
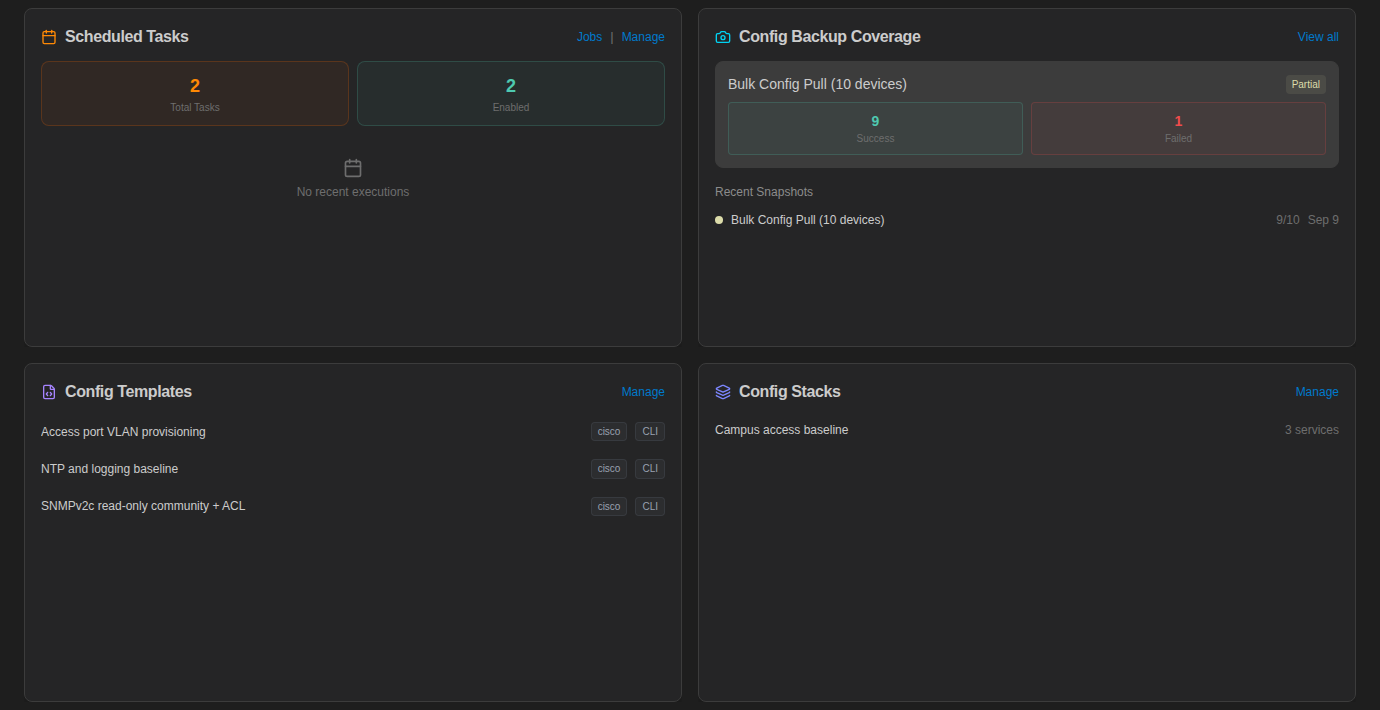
| Scheduled Tasks | Task counts and recent executions |
| Config Backup Coverage | Results of recent config snapshots |
| Config Templates / Config Stacks | Your templates and stacks |
| Recent Deployments / Recent Jobs | Latest deployments and jobs with status |
| Live SSH Sessions / Terminal Sessions | Who is connected to devices right now, and terminal session capacity |
| AI SSH Activity | Commands the AI ran on devices in the last 24 hours |
| HA / Clustering | Single-instance or active-active, and the registered API instances |
| Recent Activity | Latest Activity Monitor entries |
| Crawler Jobs Queue | Discovery job queue |
| Platform Containers | Container status |
Enabled plugins can contribute additional dashboard panels.
Customize the Layout
- Click Edit Layout at the top right of the dashboard.
- Drag panels to reorder them and drag their edges to resize.
- Use Add Panel to bring back a hidden panel, or remove a panel you don't need. Reset Layout restores the default arrangement.
- Click Lock Layout when you're done.
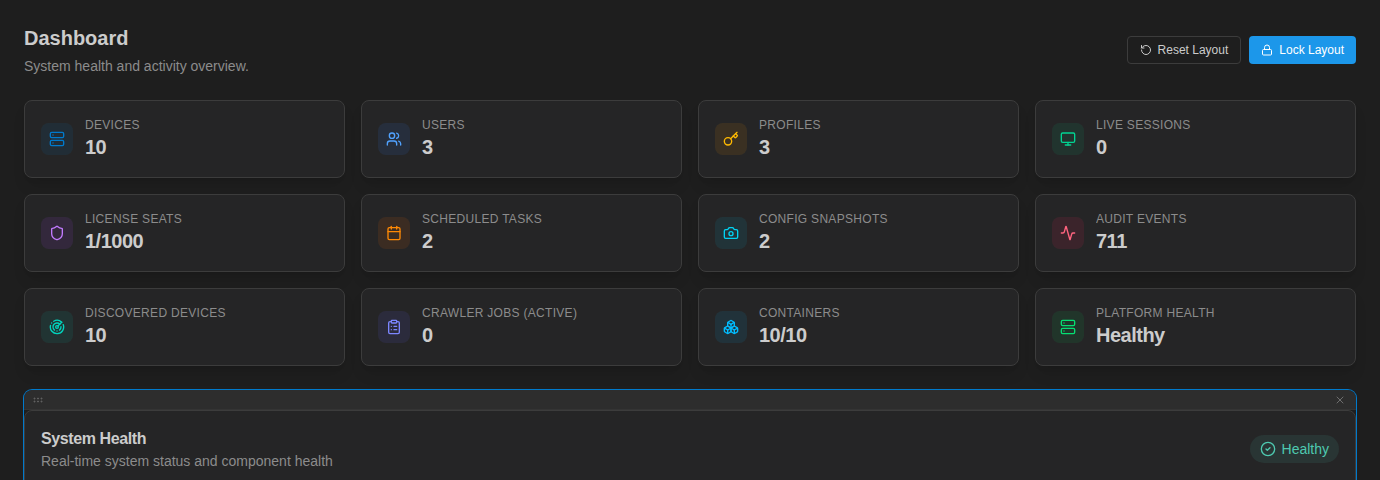
Your layout is remembered in your browser.
Header Bar
From left to right, the header shows:
- The current page title.
- The global search box (see below).
- Terminal — opens the web terminal (
/terminal/) in a new tab, signed in to the same Controller. - The organization switcher — platform administrators only. See Organizations.
- The theme toggle (dark is the default).
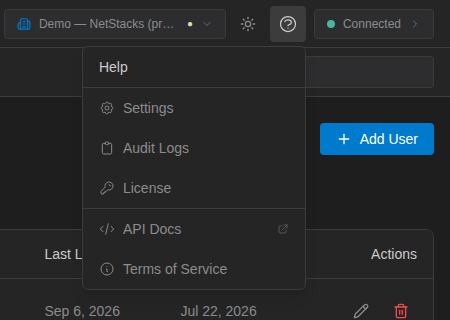
- Help (?) — shortcuts to Settings, Audit Logs, License, API Docs (the interactive Swagger UI at
/swagger-ui) and Terms of Service. - The connection status pill (Connected / Disconnected).
Global Search
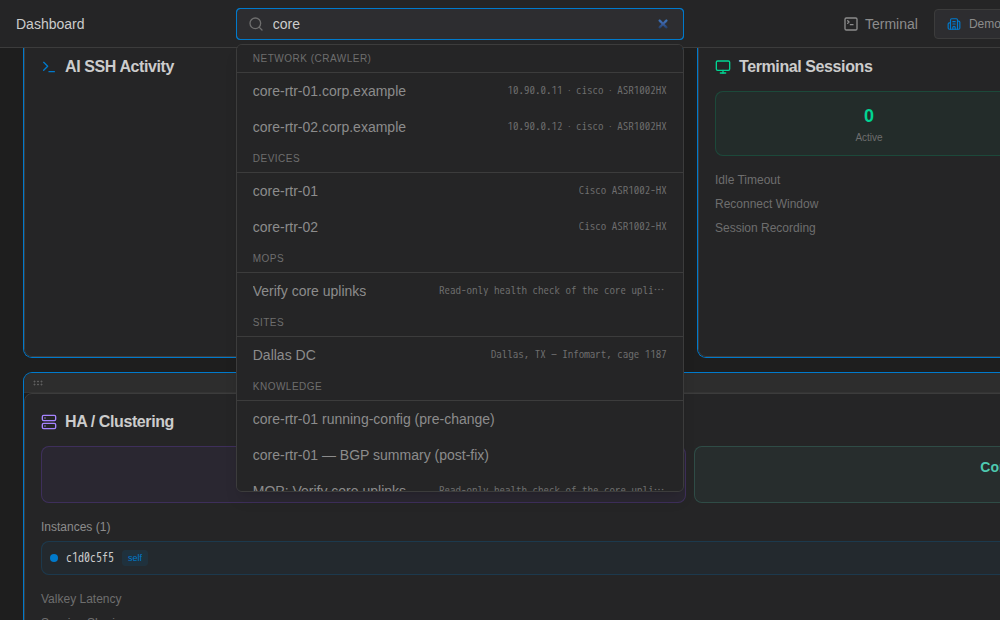
Press Ctrl+K (⌘+K on macOS) or click the search box. Free text searches devices, config backups, templates, stacks, MOPs, scripts, sites, profiles, knowledge base documents, users, roles, credentials (names and hosts only) and topologies, plus discovery data and admin pages. Press Enter to open the first result or Esc to close.
Type a scope prefix to narrow the search, or type @ to pick one from a list:
| Prefix | Searches |
|---|---|
mac:, node: | Discovered endpoints by MAC address |
ip: | Discovered devices by IP |
port:, vlan: | Discovered ports and VLANs |
device: / dev: | Devices |
backup: / config: / snapshot: | Config backups |
template: / tmpl: | Config templates |
stack:, mop:, script:, site:, profile: | Stacks, MOPs, scripts, sites, connection profiles |
kb: / knowledge: | Knowledge base |
user:, role: | Users and roles |
cred: / credential: | Credentials (name and host only) |
topology: / topo: | Topologies |
Connection Status Popover
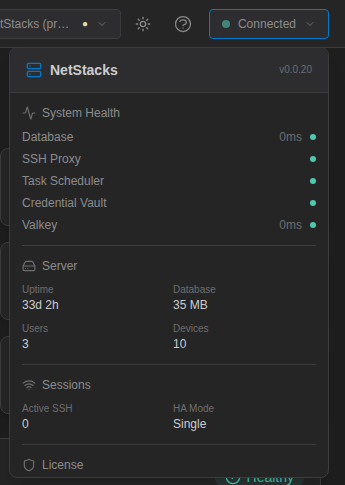
The status pill checks the Controller every 15 seconds. Click it for a quick platform summary: system health of each component, server uptime, database size, user and device counts, active SSH sessions and HA mode, license tier and seats, and enabled plugins.