Platform Health & Deployment Info
EnterpriseMonitor NetStacks Controller containers, plugins and discovery jobs, restart services from the admin console, view deployment information, and manage user jumpbox containers.
Overview
Three pages in Administration → System help you operate the Controller itself:
- Platform Health (
/admin/platform) — every container in the deployment, plugins and discovery jobs. - Deployment Info (
/admin/system) — version, organization details, resource usage, and database backup/restore. - Jumpboxes (
/admin/jumpboxes) — per-user jumpbox containers.
Container controls, backups and jumpbox actions require the System Settings permission.
Platform Health
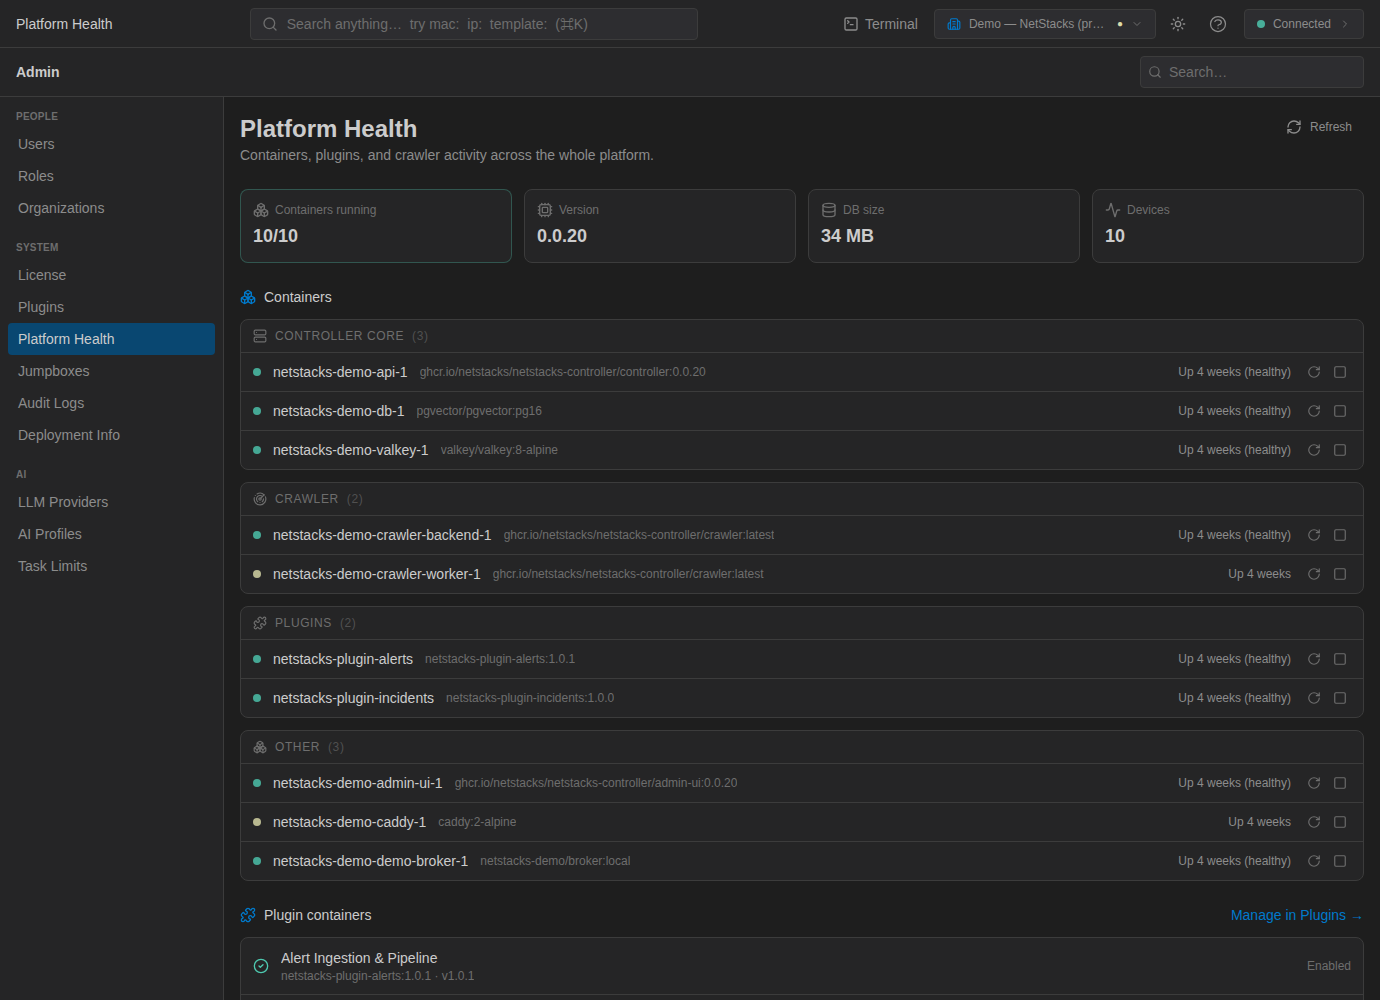
The summary cards show Containers running, the Controller Version, DB size and the number of Devices. Below them:
- Containers — grouped as Controller Core (api, db, valkey), Crawler (backend and worker), Plugins and Other (for example the admin-ui front end). Each row shows the container name, image and tag, and uptime/health.
- Plugin containers — installed plugins and whether they are enabled, with a Manage in Plugins link.
- Crawler jobs — the most recent discovery jobs and their status.
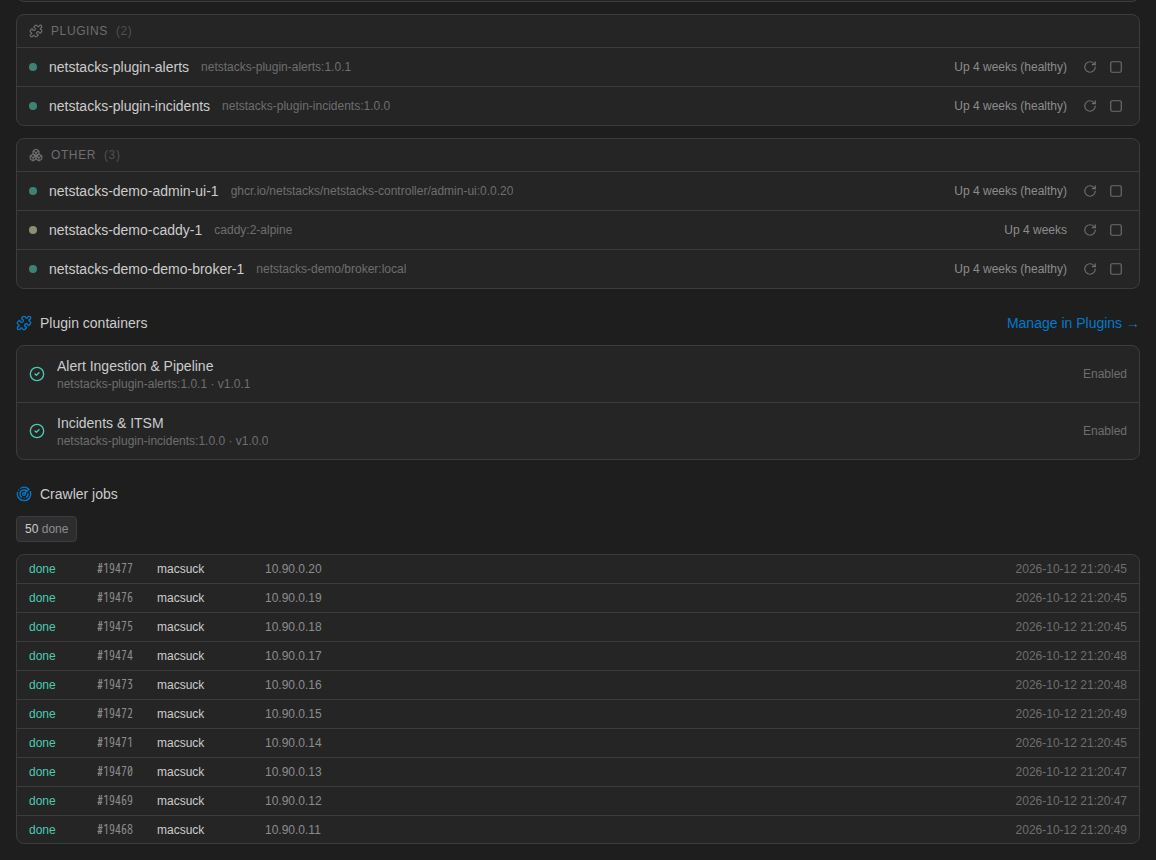
Click Refresh to update the page.
Restart, Stop and Start Containers
Each container row has Restart, Stop and Start icon buttons. After you click one, a confirmation message such as "restart sent to netstacks-api-1" appears. Only containers that belong to the Controller's own Compose project can be controlled.
Stopping api, db or admin-ui takes the console offline for everyone. Start them again from the host with docker compose up -d.
Deployment Info
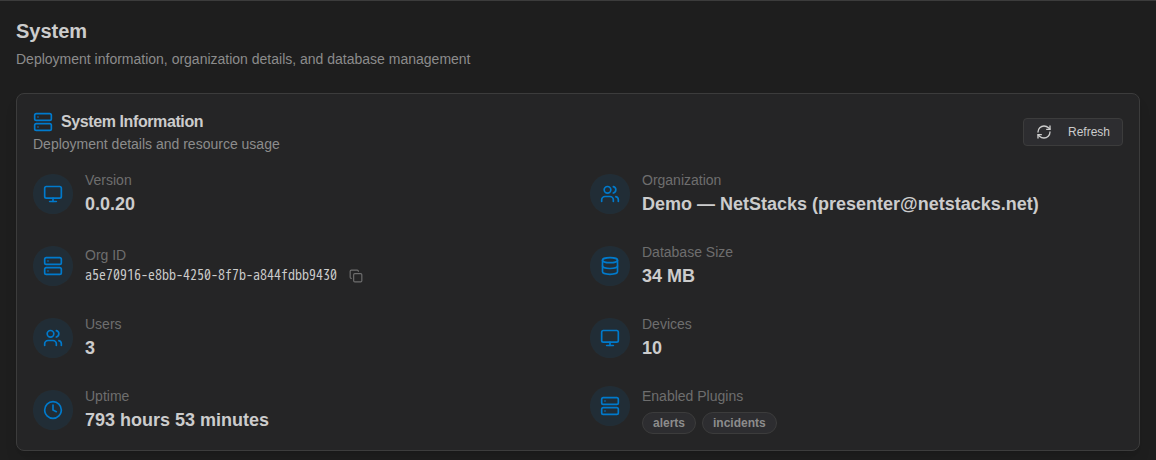
The System Information card shows the Controller Version, the current Organization and its Org ID (with a copy button), Database Size, number of Users and Devices, Uptime, and Enabled Plugins.
The Database Management card is where you download and restore backups — see Upgrades & Backups.
Jumpboxes
A jumpbox is a per-user Linux container the Controller creates on demand when a user opens a Local Terminal in the web terminal or runs a device script. It includes common network tooling (SSH and Telnet clients, ping, traceroute, mtr, nmap, dig, git, vim/nano, jq) and a Python environment with netmiko, napalm, paramiko, textfsm, ttp, jinja2 and pyyaml.
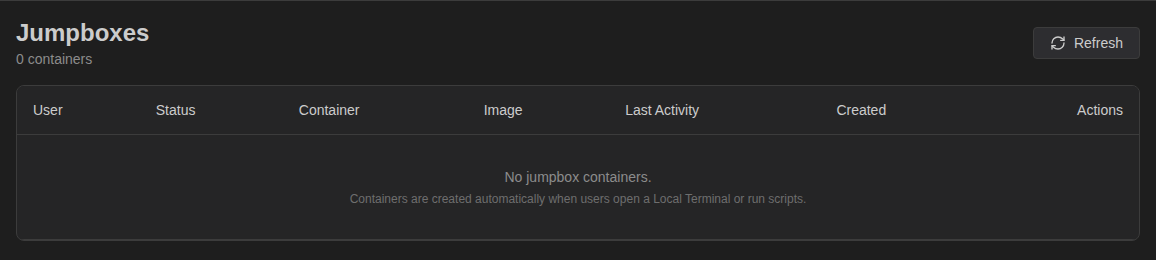
The Jumpboxes page lists each container with User, Status, Container, Image, Last Activity and Created, and icon actions to stop, restart, start or remove it. A removed jumpbox is recreated the next time the user needs one.
Configure jumpboxes under Settings → Jumpboxes: whether they are enabled, the image (default ghcr.io/netstacks/netstacks-controller/jumpbox:latest), and optional registry credentials for pulling a private custom image.
Health Endpoints for Monitoring
Point your monitoring system at these endpoints (no login required):
curl -k https://controller.example.com:3000/health   # {"status":"ok","version":"..."}
curl -k https://controller.example.com:3000/ready    # status, database, valkey
/ready reports ready only when the database (and Valkey, if configured) is reachable.